The Dynamic EGA workflow ended with a
demonstration rather than a test: population, group, and individual
structures disagreed, and a handful of individuals were shown to match
their own group rather than the pooled population. ergoInfo
and boot.ergoInfo turn that demonstration into a formal
statistical test — and infoCluster takes the next logical
step, asking what structure does describe individuals well, if
the population doesn’t.
We’ll reuse the same sim.dynEGA data and the same
individual-and-population dynEGA call from that
workflow.
# Load {EGAnet}
library(EGAnet)

dyn_all <- dynEGA(
  data = sim.dynEGA, n.embed = 5, tau = 1,
  delta = 1, use.derivatives = 1, ncores = 8,
  level = c("individual", "population"), seed = 1
)
The Ergodicity Information Index
ergoInfo quantifies how much information is lost when
you describe every individual’s network using the population’s network
instead of their own — the same question the Dynamic EGA workflow asked visually, now as
a single number:
eii <- ergoInfo(dynEGA.object = dyn_all, use = "unweighted")
eii
EII Method: Unweighted
Shuffles: 5000
EII: 2.522533On its own, this EII value doesn’t say much — it needs a baseline for
“how much information loss would we expect from a random process?”
That’s what boot.ergoInfo provides.
Testing Ergodicity
boot.ergoInfo builds a null distribution by repeatedly
scrambling each individual’s shared edges with the population
(while holding their unique edges fixed), then checks whether the real
EII is meaningfully lower than that null distribution. If it is, the
population structure actually captures something real about individuals;
if it isn’t, the population structure is basically noise as far as any
one person is concerned.
boot_eii <- boot.ergoInfo(
  dynEGA.object = dyn_all, EII = eii,
  ncores = 8, iter = 100
)
boot_eii[1;m[4;mEmpirical EII
[0m[0mEII Method: Unweighted
Shuffles: 5000
EII: 2.5225
[1;m[4;mBootstrap EII
[0m[0mIterations: 100
Mean = 2.5158 (SD = 0.0039)
p-value = 0.9505
Ergodic: No
Interpretation:
The empirical EII was not different from values that would be expected if the process was random, meaning the empirical data cannot be described by the population structure -- significant information is lost when collapsing across to the population structure.plot(boot_eii)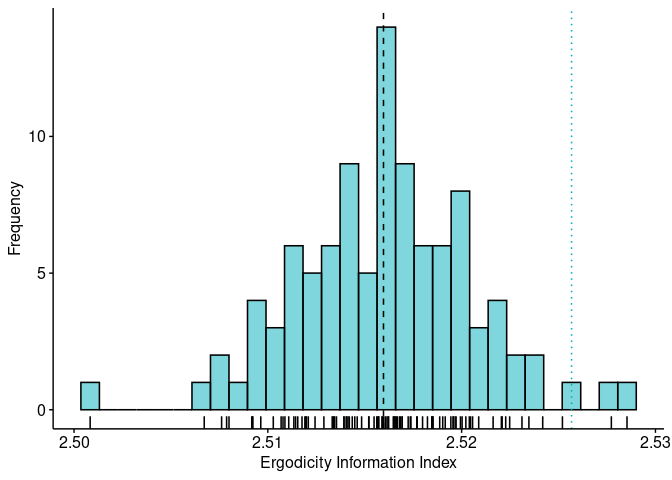
The empirical EII isn’t distinguishable from the null distribution
it’s compared against, so the test comes back non-ergodic: the
population structure is not a sufficient stand-in for these
individuals. This is the same conclusion the Dynamic EGA workflow reached by inspection
(population: four dimensions; the two groups underneath it: two and
three) — boot.ergoInfo just gives it a
p-value.
Finding the Structure That Does Fit
If the population is the wrong level to describe individuals, the
natural next question is whether there’s a better level hiding
in the data — some grouping, not necessarily the one you already know
about, that individuals’ networks actually do share.
infoCluster looks for exactly that: it measures the
Jensen-Shannon distance between every pair of individual networks, then
applies hierarchical clustering followed by Louvain consensus clustering
to find groups of individuals whose structures resemble each other.
clusters <- infoCluster(dynEGA.object = dyn_all)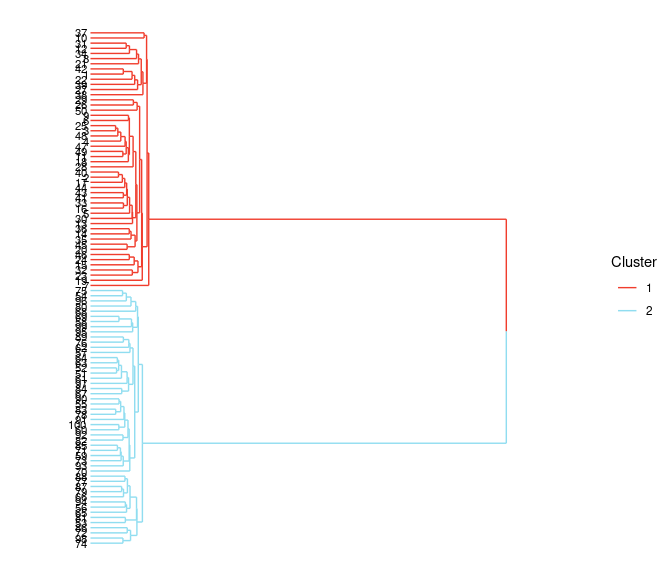
table(clusters$clusters)
 1  2
50 50
infoCluster was never told which of the two simulated
groups anyone belonged to — it only ever saw each individual’s own
network. Checking its two clusters against sim.dynEGA’s
actual Group column shows exactly how well it recovered
them:
true_group <- sim.dynEGA$Group[match(1:100, sim.dynEGA$ID)]
table(true_group = true_group, cluster = clusters$clusters)
cluster
true_group 1 2
1 50 0
2 0 50A perfect match: every individual from Group 1 lands in one cluster, every individual from Group 2 in the other. The population-level structure from the Dynamic EGA workflow didn’t describe any single person well — but the two subgroups it was quietly averaging over were recoverable directly from individual-level networks, with no group labels required.