Some constructs aren’t just multidimensional — they’re
multidimensional and organized under a broader, more general
factor. hierEGA estimates that kind of structure directly:
a lower-order EGA
on the items themselves, and a higher-order EGA on the
dimensions that emerge from it. genTEFI then gives a single
fit statistic across both levels at once.
hierEGAis still an experimental part of{EGAnet}— the function and its output may continue to change as it’s validated further. Treat the interpretation below as illustrative of the method rather than a finished analysis.
We’ll use the optimism dataset: 10 items from the
Revised Life Orientation Test (LOT-R), a scale that mixes
optimistically- and pessimistically-worded items and is a well-known
candidate for this kind of layered structure.
# Load {EGAnet}
library(EGAnet)

opt_hier <- hierEGA(
  data = optimism, scores = "network",
  plot.EGA = FALSE # No plot for CRAN checks
)
# Print results
summary(opt_hier)[1;m[4;mLower Order
[0m[0mModel: GLASSO (EBIC with gamma = 0.5)
Correlations: auto
Lambda: 0.0696795340820148 (n = 100, ratio = 0.1)
Number of nodes: 10
Number of edges: 34
Edge density: 0.756
Non-zero edge weights:
M SD Min Max
0.059 0.164 -0.231 0.438
----
Consensus Method: Most Common (1000 iterations)
Algorithm: Louvain
Order: Lower
Number of communities: 4
O1 O2 O3 O4 O5 O6 O7 O8 O9 O10
1 2 3 4 2 4 3 2 3 1
----
Unidimensional Method: Louvain (Most Common for 1000 iterations)
Unidimensional: No
----
TEFI: -2.958
------------
[1;m[4;mHigher Order
[0m[0mModel: GLASSO (EBIC with gamma = 0.5)
Correlations: auto
Lambda: 0.0605080059973183 (n = 100, ratio = 0.1)
Number of nodes: 4
Number of edges: 4
Edge density: 0.667
Non-zero edge weights:
M SD Min Max
0.013 0.338 -0.304 0.442
----
Algorithm: Louvain
Number of communities: 1
1 2 3 4
1 1 1 1
----
Unidimensional Method: Louvain
Unidimensional: Yes
----
TEFI: -8.537
----
Generalized TEFI: -11.494
----
Interpretation: Based on lower (-2.958) and higher (-8.537) TEFI, there is better fit for a bifactor structure than correlated lower order factor structureTwo Levels, Two Structures
The lower-order EGA splits the 10 LOT-R items into four
small dimensions (TEFI = -2.852). The higher-order EGA then
takes those four dimensions as its own “items” and finds that all four
collapse into a single higher-order dimension (TEFI = -8.829) —
consistent with the LOT-R’s usual reading as one general
optimism–pessimism factor sitting above a handful of narrower item
clusters.
plot(opt_hier, plot.type = "multilevel")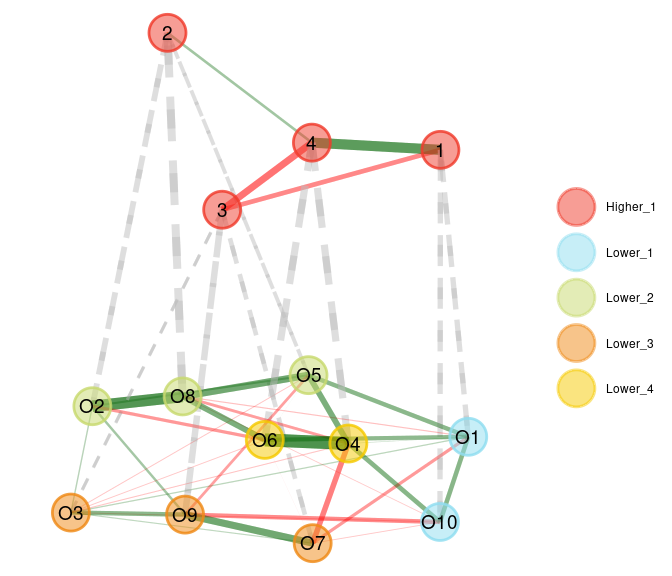
Generalized TEFI
genTEFI combines both levels into one number, which is
what makes hierEGA solutions comparable to a single-level
EGA on the same items:
genTEFI(opt_hier) VN.Entropy.Fit Level_1_VN Level_2_VN
1 -11.49416 -2.95751 -8.536655The comparison that matters is between the two levels’ own TEFI
values: the higher-order TEFI (-8.829) is lower (more negative, better
fit) than the lower-order TEFI (-2.852). That ordering — higher-order
fit beating lower-order fit — is what favors a bifactor-like structure,
where a general factor sits above the specific item clusters, over
treating those four lower-order clusters as independent, uncorrelated
dimensions. genTEFI’s combined value (-11.681) is what
makes this whole hierEGA solution comparable to a flat,
single-level EGA on the same items; it’s not itself the
basis for the bifactor-vs-correlated-factors call.
hierEGA’s built-in interpretation reports the
higher-vs-lower comparison directly:
attr(opt_hier, "methods")$interpretation[1] "Based on lower (-2.958) and higher (-8.537) TEFI, there is better fit for a bifactor structure than correlated lower order factor structure"